Listen to this article
Numbers in a transaction list tell you what happened. Charts tell you what is happening. The difference matters, because a single grocery run looks fine on its own, but a grocery line that has crept up for four months in a row is a story you want to catch early. WIMM's Reports page turns your transactions into pictures so those stories surface on their own, and the core charts are all free.

Photo by Nicholas Cappello on Unsplash
The Reports page is organized into tabs
Open Reports and you land on a set of tabs: Overview, Trends, Categories, Accounts, and Bills. Each tab answers a different question, so you are not scrolling past charts you did not ask for.
Overview is the at-a-glance picture. Trends is for change over time. Categories breaks your spending down by where it went. Accounts shows your balances. Bills focuses on your recurring costs. You move between them like browser tabs, and the charts redraw for whatever range you have picked.
The spending donut shows where your money went
The donut chart answers the most common question people have about their money: where did it all go? It splits your spending by category into slices, so the big slices jump out immediately. If "Dining Out" is taking a quarter of the circle, you will see that before you have read a single number.
It is the fastest way to sanity-check a month. Most people have a rough idea of their spending in their head, and the donut either confirms it or quietly corrects it.
Income vs expense, side by side
The income vs expense chart puts your money in and your money out next to each other as side-by-side bars, not stacked. That choice is deliberate. Stacked bars hide whether you came out ahead, because you have to do the subtraction in your head. Side-by-side bars let you read it at a glance: if the income bar is taller than the expense bar, you were net positive that period, and if it is shorter, you were not.
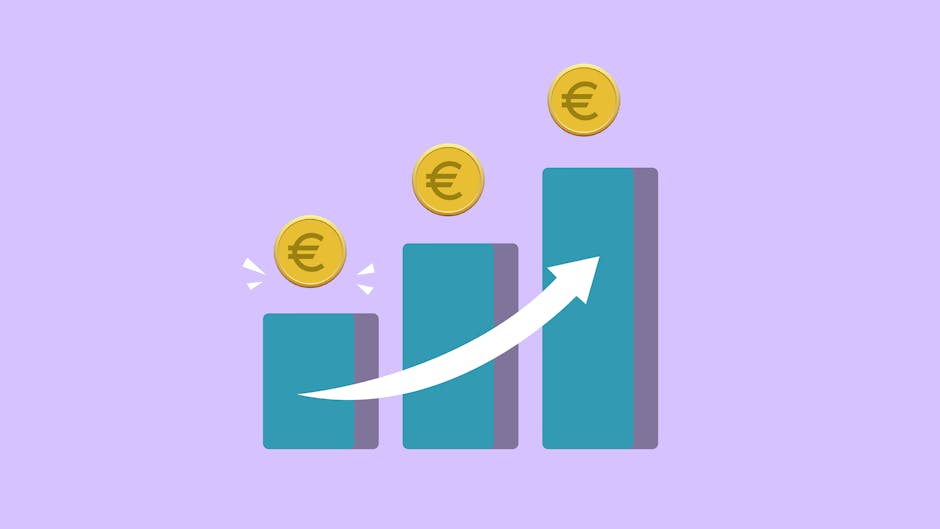
Photo by Monstera Production on Pexels
Run this across several months and the pattern is obvious. A run of months where expenses edge out income is the kind of thing you want to notice while it is still a trend and not yet a problem.
The monthly comparison grid and the category trend chart
Two charts do the heavy lifting for spotting change.
The monthly comparison is a table: your categories down one side, the months across the top, roughly a year of history in a single grid. Scan any row left to right and you can see a category climbing, falling, or holding steady. It is dense on purpose, because density is what lets you compare twelve months without clicking twelve times.
The category trend chart zooms into one category over time. It draws the spending line and adds reference lines for the average, the minimum, and the maximum, so a single month is always shown against its own history. A month that pokes above your usual maximum is not just high, it is the highest it has ever been, and the chart says so.
Tip
Lifestyle creep is sneaky because it never spikes. It just drifts up a little each month until your "normal" is a lot higher than it used to be. Open the category trend chart for groceries, dining, or subscriptions every couple of months and watch the line against its average. If the recent points keep landing above the average line, that is creep, and now you have caught it.
The account balance trend

Photo by Towfiqu barbhuiya on Pexels
The last core chart tracks an account balance over time. It is the chart that tells you whether your savings are actually growing or just bouncing around the same number, and whether a checking account is trending toward empty before payday. Balances move for a hundred small reasons, and the line smooths all of that into one honest direction.
Free charts, Premium AI on top
Everything above is free. The donut, income vs expense, the monthly comparison grid, the category trend chart, and the account balance trend are all part of WIMM at no cost.
What sits on top, and is Premium, is the AI analysis. The Smart Budget Wizard reads your last few months of spending and suggests envelope amounts for you, so you are not guessing at targets. And natural-language queries let you ask plain questions like "how much did I spend on groceries last month" and get a straight answer back, no chart-reading required.
That split is intentional. The charts are the kind of thing every budgeting app used to give you for free, so WIMM keeps them free. The AI is the part that runs real compute on your behalf, so it lives on Premium.
When Mint shut down, the thing a lot of people genuinely missed was the at-a-glance charts, the quick visual read on a month that did not require exporting anything. WIMM brings that core back for free, and reserves the heavier AI analysis for those who want it.
See it with sample data
The fastest way to understand the Reports page is to open it with a populated account and just click through the tabs. The demo does exactly that, with a sample household already full of transactions to chart. Try it at app.wimm.money/demo, then open your own account and watch your real history fill in.
Try WIMM today
The demo loads with realistic data and no signup. See what this article describes in action.